Real-time Human Detection with OpenCV
Let's use the HOG algorithm implemented in OpenCV to detect people in real time in a video stream!
Introduction
Today, we will write a program that can detect people in a video stream, almost in real-time (it will depend on how fast your CPU is.)
In my article about object detection with darknet , we have seen how to use deep learning to detect objects in an image. For this, we used a YOLOv3 neural network, pre-trained to detect and identify objects in 80 categories (person, car, truck, potted plant, giraffe, ...).
YOLOv3 is the state-of-the-art object detection algorithm: It is very accurate and fast when evaluated on powerful GPUs, compared to other algorithms.
However, even with a GeForce GTX 1080 Ti, it takes 200 ms to detect objects in a single image. And for real time detection, one needs to go down to 40 ms / image or less, to be able to process video streams at 24 images / s.
Also, powerful deep learning workstations are expensive, and they consume a lot of power. So they are certainly not adequate if your goal is to build a small home surveillance system that's running all the time.
So here, we won't do any deep learning. Instead, we will use simple machine learning tools that can be evaluated really fast on a CPU.
In this post, you will learn:
- How to install OpenCV, which provides simple tools for video input and output, and for machine learning;
- How to write a small script to perform person detection in a video stream from your webcam, or in one of your movies, with the HOG algorithm (Histograms of Oriented Gradients);
- How HOG works.
Install OpenCV
OpenCV is the open source computer vision library, and it's super powerful. Here are a few random things that you can do with it:
- video input and output
- 3D reconstruction
- video analysis
- object detection
- image stitching to make panoramas
- ...
You could start with the OpenCV tutorial , and also have a look at the very nice blog from Adrian Rosebrock. That's actually where I first got in touch with OpenCV!
So let's install the tool. Today we'll install it through Anaconda. I assume that you have already installed anaconda for python 3.X. If not, you can follow these instructions .
Add the following packages to anaconda: opencv numpy matplotlib
If you know how to use the command line, you can install them by typing:
conda install opencv numpy matplotlib
Otherwise, just use the anaconda navigator.
Accessing your webcam
Reading from your webcam is easy with OpenCV, just write the following script and run it with python:
import numpy as np
import cv2

cv2.startWindowThread()
cap = cv2.VideoCapture(0)

while(True):
    # reading the frame
    ret, frame = cap.read()
    # displaying the frame
    cv2.imshow('frame',frame)
    if cv2.waitKey(1) & 0xFF == ord('q'):
        # breaking the loop if the user types q
        # note that the video window must be highlighted!
        break

cap.release()
cv2.destroyAllWindows()
# the following is necessary on the mac,
# maybe not on other platforms:
cv2.waitKey(1)
You should see a window pop up with the image from your webcam:

Now let's try and manipulate the video stream. The video is read frame by frame, so we can edit the frame before displaying it. Add the following lines before displaying the frame:
    # turn to greyscale:
    frame = cv2.cvtColor(frame, cv2.COLOR_RGB2GRAY)
    # apply threshold. all pixels with a level larger than 80 are shown in white. the others are shown in black:
    ret,frame = cv2.threshold(frame,80,255,cv2.THRESH_BINARY)

People detection
OpenCV features an implementation for a very fast human detection method, called HOG (Histograms of Oriented Gradients).
This method is trained to detect pedestrians, which are human mostly standing up, and fully visible. So do not expect it to work well in other cases.
Before discussing this method, we'll give it a try. Modify your script as follows:
# import the necessary packages
import numpy as np
import cv2

# initialize the HOG descriptor/person detector
hog = cv2.HOGDescriptor()
hog.setSVMDetector(cv2.HOGDescriptor_getDefaultPeopleDetector())

cv2.startWindowThread()

# open webcam video stream
cap = cv2.VideoCapture(0)

# the output will be written to output.avi
out = cv2.VideoWriter(
    'output.avi',
    cv2.VideoWriter_fourcc(*'MJPG'),
    15.,
    (640,480))

while(True):
    # Capture frame-by-frame
    ret, frame = cap.read()

    # resizing for faster detection
    frame = cv2.resize(frame, (640, 480))
    # using a greyscale picture, also for faster detection
    gray = cv2.cvtColor(frame, cv2.COLOR_RGB2GRAY)

    # detect people in the image
    # returns the bounding boxes for the detected objects
    boxes, weights = hog.detectMultiScale(frame, winStride=(8,8) )

    boxes = np.array([[x, y, x + w, y + h] for (x, y, w, h) in boxes])

    for (xA, yA, xB, yB) in boxes:
        # display the detected boxes in the colour picture
        cv2.rectangle(frame, (xA, yA), (xB, yB),
                          (0, 255, 0), 2)

    # Write the output video
    out.write(frame.astype('uint8'))
    # Display the resulting frame
    cv2.imshow('frame',frame)
    if cv2.waitKey(1) & 0xFF == ord('q'):
        break

# When everything done, release the capture
cap.release()
# and release the output
out.release()
# finally, close the window
cv2.destroyAllWindows()
cv2.waitKey(1)
Now run the script.
With these parameters, the detection is done almost in real time on my machine. You will see that the detector works better if the person is not too close to the camera. If the person is close, several overlapping boxes are often shown.
However, this performance is more than enough for a small home surveillance system, which will be the subject of a future article.
How does HOG work?
You're already able to detect people in a video stream, and you can stop here if you wish!
But if you want to know how the algorithm works, read on, I've tried to explain it in simple terms.
The performance of the HOG algorithm is shown in the original paper by Dalal and Triggs. However, to really understand how the algorithm works, I had to dig in the references of this paper, and especially this seminal article about hand gesture recognition.
You can also have a look at this nice blog article .
To understand how HOG ( Histograms of Oriented Gradients ) works, it's necessary to first understand what is a gradient, and what is an histogram.
What is a gradient?
For a 1D function f depending on variable x, the gradient is simply the derivative of the function. At a given point, the derivative gives the local slope of the function.
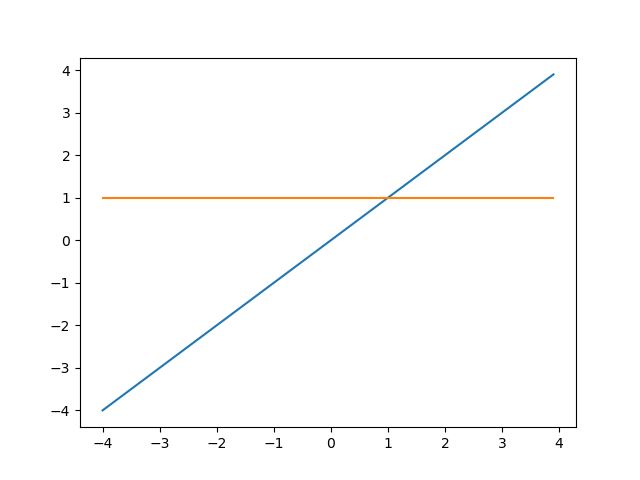
For example, let's consider the function f(x) = x. The derivative of this function is f'(x) = 1. So this function is a straight line, and its derivative is a constant, which means that the slope is a constant.
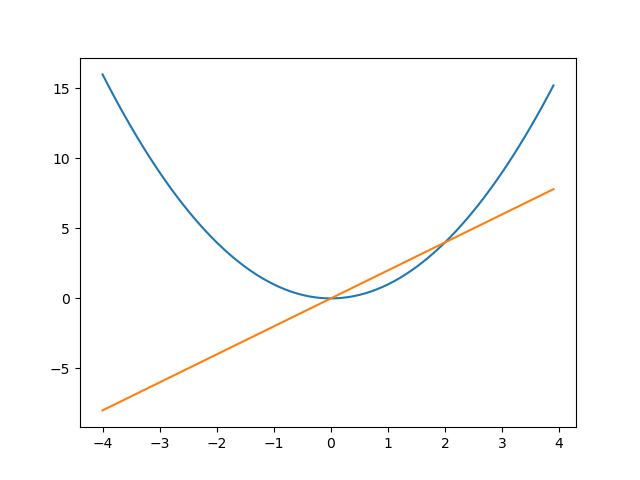
If we now consider f(x) = x^2, the derivative is f(x) = 2x. For x<0, the derivative is negative and the function is decreasing. For x>0, the derivative is positive and the function is increasing. For x = 0, the derivative is 0. This means that the local slope is 0. In other words, here, the function is locally flat.
In 2D, in the (x,y) plane, a function of x and y is a surface giving the altitude at every point. The gradient is the generalization of the derivative: at a given (x,y) point, the gradient is oriented towards the direction of maximum slope, and its magnitude is the slope of the plane tangent to the surface at this point. Here is an illustration from the wikipedia article :

Let's come back to our case. In a black and white picture, the greyscale level is analogous to the altitude, and the gradient is a measure of how fast the level changes and of the direction of the change. An edge in the picture (a black to white transition) leads to a large gradient perpendicular to the edge, from white to black. In a colour picture, one can compute a gradient for each colour level, and e.g. take the maximum gradient over the three colour levels.
So why are the gradients said to be oriented? A gradient is always oriented. It just means that the method keeps track of the gradient direction, and it makes up a good acronym, HOG.
What is an histogram?
An histogram is a data structure that is used to compress data and to represent its probability distribution. An histogram can have many dimensions but in practice, 1D and 2D histograms are most often used. In HOG, the gradients are stored in a 1D histogram, so let's focus on that.
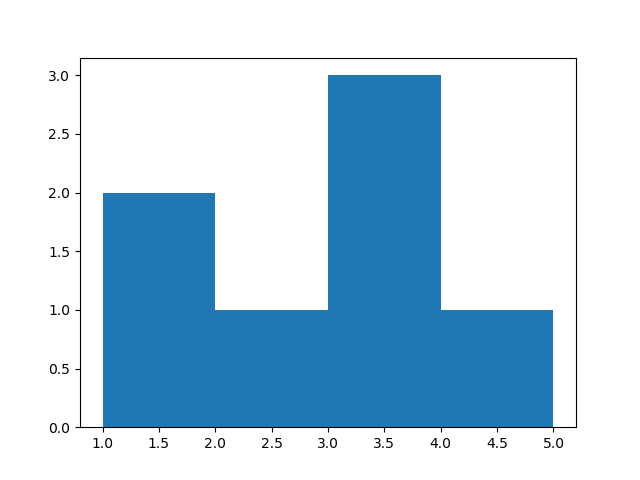
Take an array of values: [1, 1.5, 2.2, 3.5, 3.5, 3.6, 4.1].
We define the histogram by describing its bins. The bins are baskets that count the number of entries with a value falling within the bin range.
You can type this in ipython to see the histogram:
import numpy as np
import matplotlib.pyplot as plt

values = [1.1, 1.5, 2.2, 3.5, 3.5, 3.6, 4.1]
plt.hist(values, bins=4, range=(1,5))
plt.show()
You get this histogram:
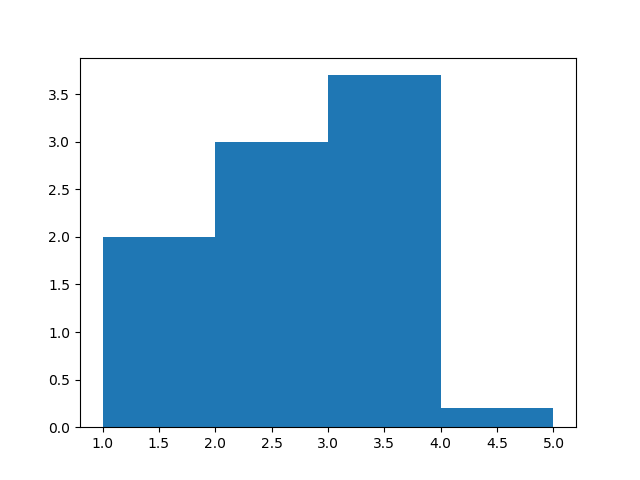
It is also possible to weight each value. When the value enters the histogram, its contribution to the bin is given by the weight, which is 1 by default. Here is a weighted histogram:
import numpy as np
import matplotlib.pyplot as plt

values = [1.1, 1.5, 2.2, 3.5, 3.5, 3.6, 4.1]
weights = [1., 1., 3., 1.2, 1.4, 1.1, 0.2]
plt.hist(values, bins=4, range=(1,5), weights=weights)
plt.show()
Histograms of Oriented Gradients
The basic idea of the method is the following:
- The picture is scanned with a detection window of varying size.
- For each position and size of the detection window, the window is subdivided in cells. The cells are in practice relatively small: they typically contain only a small part of the person to be detected, maybe the side of an arm, or the top of the head.
- In each cell, a gradient is computed for each pixel, and the gradients are used to fill an histogram: the value is the angle of the gradient, and the weight is the magnitude of the gradient.
- The histograms of all cells are put together and fed to a machine learning discriminator to decide whether the cells of the current detection window correspond to a person or not.
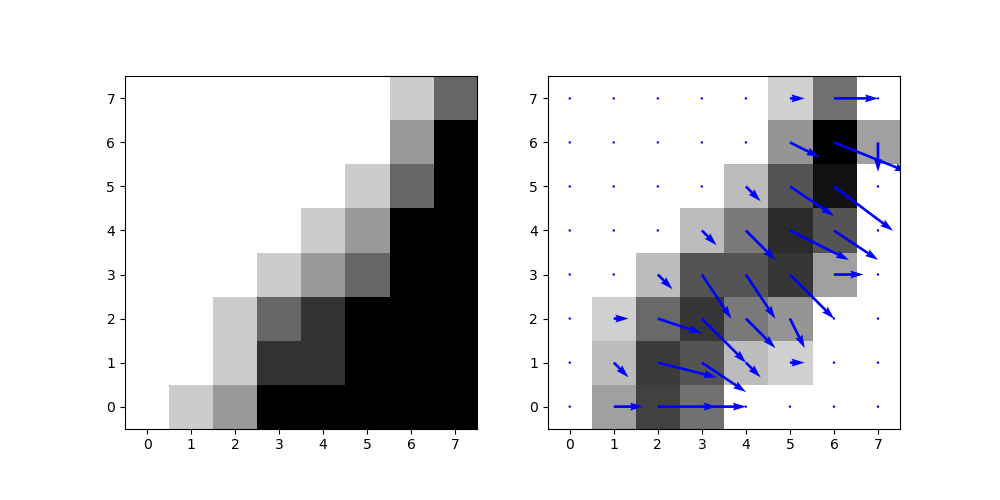
The last point is the subject of the next section. Here, let's see how the histogram of oriented gradients is built for a given cell, with a small example:
import numpy as np
import matplotlib.pyplot as plt
import cv2

cell = np.array([
    [0, 1, 2, 5, 5, 5, 5, 5],
    [0, 0, 1, 4, 4, 5, 5, 5],
    [0, 0, 1, 3, 4, 5, 5, 5],
    [0, 0, 0, 1, 2, 3, 5, 5],
    [0, 0, 0, 0, 1, 2, 5, 5],
    [0, 0, 0, 0, 0, 1, 3, 5],
    [0, 0, 0, 0, 0, 0, 2, 5],
    [0, 0, 0, 0, 0, 0, 1, 3],
    ],dtype='float64')

# compute the gradients in the x and y directions:
gradx = cv2.Sobel(cell, cv2.CV_64F,1,0,ksize=1)
grady = cv2.Sobel(cell, cv2.CV_64F,0,1,ksize=1)
# compute the magnitude and angle of the gradients
norm, angle = cv2.cartToPolar(gradx,grady,angleInDegrees=True)

plt.figure(figsize=(10,5))

# display the image
plt.subplot(1,2,1)
plt.imshow(cell, cmap='binary', origin='lower')

# display the magnitude of the gradients:
plt.subplot(1,2,2)
plt.imshow(norm, cmap='binary', origin='lower')
# and superimpose an arrow showing the gradient
# magnitude and direction:
q = plt.quiver(gradx, grady, color='blue')
plt.savefig('gradient.png')
plt.show()
You get the following plots. We see that in the gradient plot, flat surfaces disappear, and the edge is clearly visible.
Let's finally plot the histogram of oriented gradients:
plt.hist(angle.reshape(-1), weights=norm.reshape(-1), bins=20, range=(0,360))
plt.show()
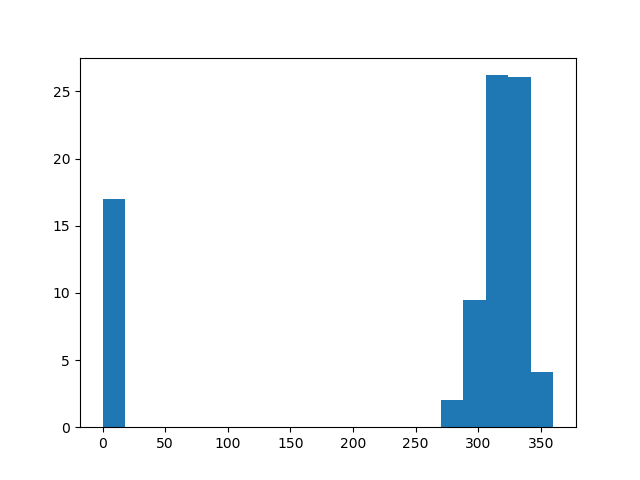
In this histogram, 0 corresponds to the gradients going to the right. There is only one arrow going down, shown in the bin [270;290[.
If several pixels in the cell have gradients with similar orientation, they contribute to the same bins. Also, large gradients contribute more. So The peak on the right side corresponds to the edge visible in the cell.
Histogramming the gradients in this way makes it possible to recognize edges easily in the cell.
Now this histogram is for a single cell. We need a procedure to analyze all cells in the current detection window to find out if the window contains a person or not.
Putting all cells together in a machine learning classifier
We have one HOG for each cell in the detection window. All HOGs are concatenated into a large array of numbers. For example, if the detection window has 8x16 = 128 cells and each HOG has 20 bins, we end up with 2560 values.
Any kind of machine learning classifier can in principle be used to take a decision (is there a person or not?) based on these values.
However, since there are a lot of dimensions (2560 in our example) and the number of images available for the training was not very large, Dalal and Triggs decided to go for a Support Vector Machine (SVM) (a linear one). That's also what is being done in the OpenCV implementation of HOG.
To explain SVMs, it's necessary to wield advanced mathematical tools, and this is way out of scope for this blog. But if you're interested and are at master level in maths or physics, you could follow this great lecture from Andrew Ng (not for the faint of heart!).
And now?
In this post, you have learnt how to:
- install OpenCV
- write a small script to perform human detection in a video stream from your webcam, or in one of your movies, with the HOG algorithm (Histograms of Oriented Gradients)
You have also learnt how HOG works.
Read more about image recognition
- Handwritten Digit Recognition with scikit-learn : simple introduction to dense neural networks and machine learning, and to the scikit-learn library.
- First Neural Network with Keras : same exercise, this time with keras.
- Tuning a Deep Convolutional Network for Image Recognition with Keras and TensorFlow (Handwritten Digits) : learn how to adapt the parameters of a convolutional network for best performance
- Image Recognition: Dogs vs Cats (92%) : discriminate pictures of dogs and cats, with special emphasis on data augmentation and the choice of the optimizer.
- Image Recognition with Transfer Learning (98.5%) : use state-of the art pre-trained models for easy and powerful image classification. Introduction to the VGG and ResNet neural networks.
- Object detection with darknet : use the darknet program and pre-trained networks to find and identify objects in many categories in a picture.
Please let me know what you think in the comments! I’ll try and answer all questions.
And if you liked this article, you can subscribe to my mailing list to be notified of new posts (no more than one mail per week I promise.)
Learn about Data Science and Machine Learning!
You can join my mailing list for new posts and exclusive content: